PowerPoint template · Reports
Diversity and inclusion landscape template
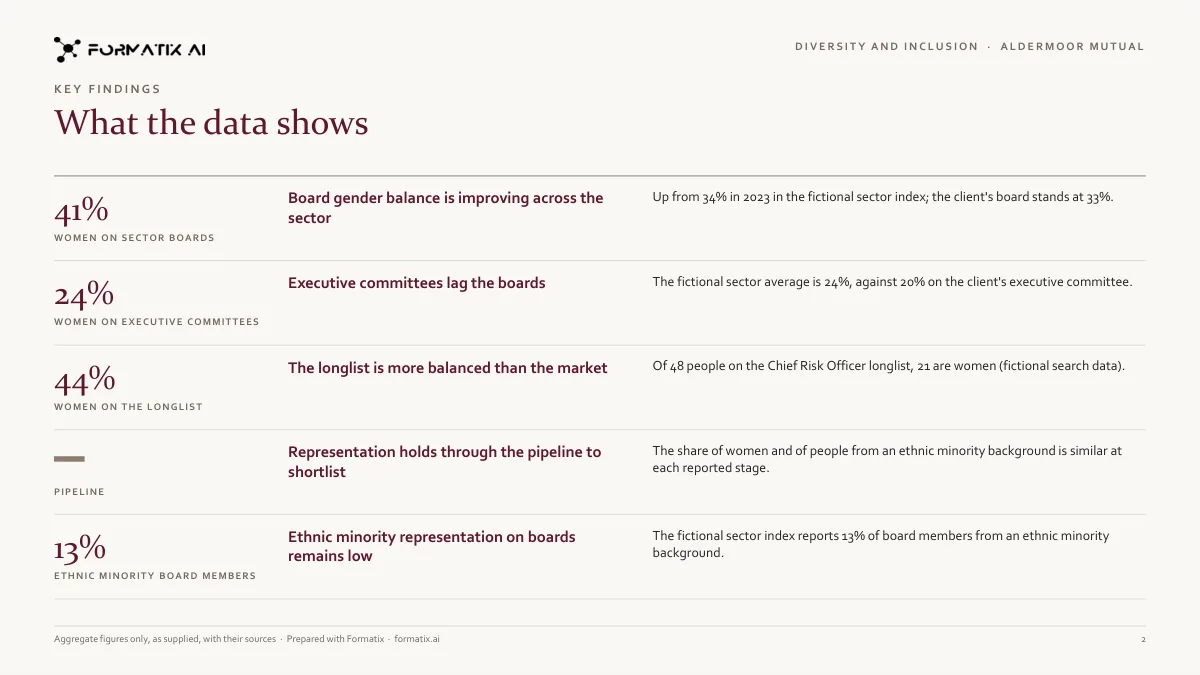
A diversity and inclusion landscape study sets the diversity of a search against the market: how representative the sector's boards and leadership are, where the client stands, how diverse the longlist and shortlist are, and what the firm recommends. This PowerPoint template presents it in the firm's brand: a cover; key findings, each with its figure and source; representation benchmarks comparing the sector, the client and the search, drawn as bars; pipeline diversity stage by stage; and recommendations on process, slate, panel and measurement. Formatix fills it only from aggregate figures supplied in the documents, such as published benchmarks and a voluntary candidate survey, and never infers anyone's characteristics.
Clients ask search firms to show, not claim, that a search reached a diverse market. That needs figures with sources, compared like for like, and handled with care. This template is built for that: group-level figures only, small groups withheld, and the source under every chart.
10 free credits, no card needed. One credit fills one document.
An editable file with neutral branding and a fictional example candidate, to fill in by hand. Formatix fills it automatically from a CV.

What's in the template
A diversity and inclusion landscape study: key findings, representation benchmarks, the diversity of the candidate pipeline and recommendations, from the aggregate data supplied.
- Cover with the scope, the client, the search and who prepared it
- Key findings, each with its figure and source
- Representation benchmarks: the sector, the client and the search side by side, drawn as bars
- Pipeline diversity stage by stage, with any group under five people withheld
- Recommendations on process, slate, panel and measurement
What it's for: Setting a search's diversity goals against the market with a client, from aggregate data.
PowerPointDelivered as an editable PowerPoint file, or saved as PDF.
Who uses it
Executive search firms
Diversity reporting on a search for the client and the nominations committee.
Board practices
Board diversity benchmarks set against the client's own board.
In-house talent and inclusion teams
Leadership representation and pipeline figures for the executive committee.
Every slide of the example
The example is in Formatix branding with fictional content. When you pick this template, it is rebuilt with your logo, colours and fonts before you use it.
How you use it
- 1
Pick the template
Open Formatix, choose this template in Studio, and give us your website. We pull your logo, colours and fonts and rebuild the template in your brand. You see a sample before you use it.
- 2
Drop the data
Upload the representation benchmarks, the client's own figures, aggregate pipeline data such as a voluntary candidate survey, and your notes. One credit fills one document.
- 3
Check and send
The filled document appears beside the original for checking. Edit anything in place, then download the Word, PowerPoint or Excel file, or save it as PDF.
Download or automate? The free download is a plain file you fill in by hand. In Formatix the template is rebuilt in your brand, with your logo, colours and fonts taken from your website, and filled from a CV or your notes in about a minute. What you keep is the finished document: an editable Word, PowerPoint or Excel file.
Ask for changes in plain words, such as "move the photo to the right" or "add a Languages section", and the template is updated with the rest of its formatting kept. If you already have a document you send clients, upload that instead and Formatix turns it into a template. How Studio builds templates
Questions about this template
- What is in a diversity and inclusion landscape study?
- A cover with the scope, the client and the search; three to five key findings with their figures and sources; representation benchmarks, up to six measures compared across the sector benchmark, the client and the search; pipeline diversity at each stage, such as the longlist and the shortlist; and recommendations.
- Does Formatix work out candidates' characteristics?
- No. It never infers or states anyone's sex, gender, ethnicity, disability, age or any other personal characteristic, from names, photos, CVs or anything else. Only group-level figures that your documents present as aggregate data, for example from a voluntary self-reported survey, are used.
- What happens with small numbers?
- A figure is never shown for a pipeline stage or group of fewer than five people; the stage is left out and the deck notes that the figure is withheld because the number is too small.
- Where do the percentages come from?
- Each percentage is stated in your documents, or is a direct division of two counts your documents give for the same group, and is shown with its source when the documents give one. Nothing is estimated from general knowledge.
- Is this a download?
- No. The deck is built in your brand inside Formatix and filled from your data; what you download is the finished PowerPoint file or PDF.
Related templates and pages
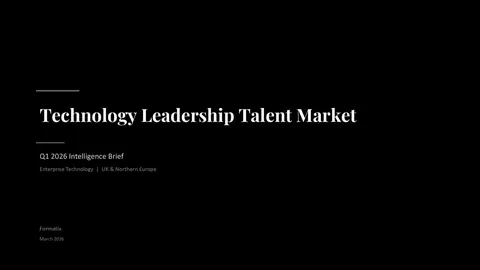 PowerPointMarket intelligence briefA market intelligence brief for a client or a search: key findings, market trends, the competitive landscape, talent availability, compensation benchmarks and what it means for the search.
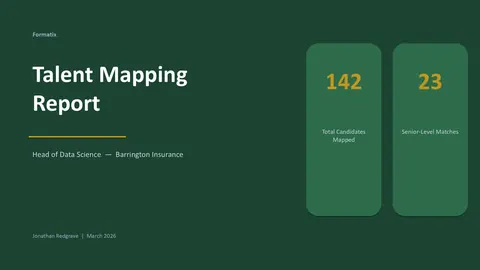 PowerPointTalent mappingA talent-mapping presentation: the market overview, a map of target organisations by segment, the talent pool identified, and observations and recommendations.
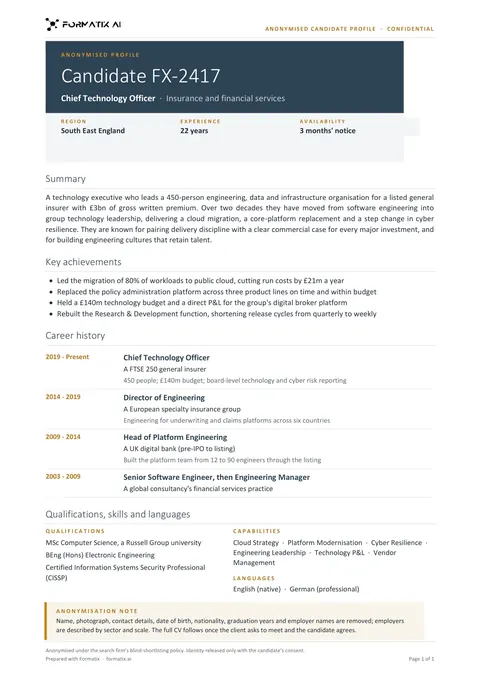 WordBlind profileAn anonymised profile that shows experience and fit without the candidate's name, contact details or photo.
Use the diversity and inclusion landscape in your brand
Give us your website, and the template is rebuilt with your logo, colours and fonts. Your first ten documents are free, with no card and no expiry.